Chicago: America's Quintessential Bifurcated City
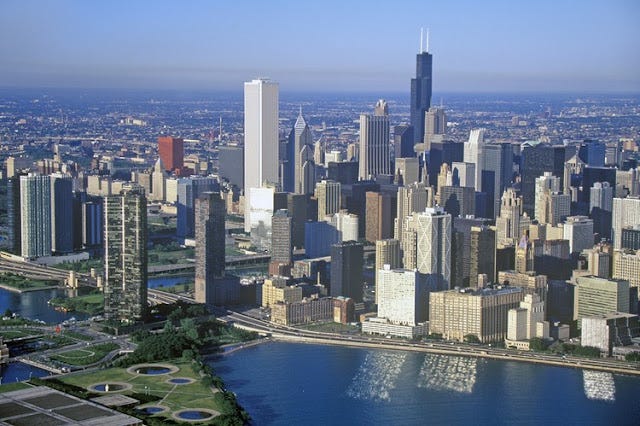
Figure 1: Chicago skyline. Source: archdaily.com
(Note: I spent much of 2018 doing a deep dive study of Chicago's historical development patterns and trends, as part of the Center for Opportunity Urbanism's report entitled Beyond Gentrification: Towards More Equitable Urban Growth (follow the link to see the full report). The report analyzes development patterns and trends for Los Angeles and Dallas as well, providing a broad perspective of metro development types and potential policy actions. The full report was released at the end of January of this year at an event at the George W. Bush Presidential Center in Dallas. The report received a fair amount of coverage in Dallas upon its release, but has probably been under the radar in Los Angeles and Chicago. I've written about my contribution to the report and provided some summaries of my analysis and findings, but lately I've been thinking that the Chicago portion could benefit from more exposure that could spark discussion. In that vein I've posted a lightly re-edited version of the Chicago section of the report here at CSY. Be forewarned: this is long, in excess of 4,700 words. But if you love cities, you'll find it enlightening. -Pete)
Introduction
On its surface, Chicago exhibits many of the traits and characteristics associated with gentrification in many of the nation’s top global cities, like New York, Boston, and Washington, D.C. on the East Coast, and the San Francisco Bay Area/Silicon Valley and Seattle on the West Coast. Chicago certainly has the gleaming downtown area booming with new construction, surrounding neighborhoods with large concentrations of young, educated and affluent urbanites living in dense, walkable areas adjacent to transit, and retail, entertainment and institutional development sprouting to serve the rapidly rising demographic. The revitalization apparent in the nation’s “superstar” cities is visible in Chicago as well.
However, a deeper look into Chicago’s demographic and economic history over the last half century shows that it exhibits just as many traits and characteristics more commonly Chicago is the largest city and economic and cultural capital of the Midwest, putting it at the forefront of revitalization in a region that still suffers from the loss of manufacturing employment and economy, and rigid segregation patterns established in the wake of the Great Migration more than 100 years ago.
Defining Gentrification
The word “gentrification” has become a loaded term with as many meanings as there are people willing to define it. It’s come to be known for its impacts rather than its process, stoking fears about the displacement of low-income and moderate-income residents in favor of affluent ones, the loss of local neighborhood businesses and institutions, and questions about neighborhood identity, authenticity, ethnicity, class and ownership. For the purposes of this report I will forgo the impacts and focus on the transformation of low-income or moderate-income urban neighborhoods into high-income neighborhoods. Low-income, moderate-income and high-income neighborhoods will be evaluated at the Chicago Community Area (CCA) level in Chicago, a historical set of 77 distinct neighborhood collections, using comparisons against metro area data for low-income, moderate-income and high-income determination.
Chicago’s Gentrification Catalysts
It’s becoming clearer that gentrification in Chicago wasn’t completely a natural outcome; it received assistance from a variety of sources. Chicago gentrification activity has benefited in part from a series of local policy actions, or the interpretation and implementation of state and federal policies and programs. Those policies, roughly listed chronologically, are as follows:
Development and placement of public housing
Interstate highway development
Urban renewal clearance
Targeted transit improvements on Chicago Transit Authority lines
Targeted City investment in public facilities (parks, police and fire stations, selected schools)
Widespread utilization of Tax Increment Financing (TIF) Districts
Development and expansion of magnet and charter schools
Deconstruction of Chicago Housing Authority public housing complexes
Large-scale school closures by Chicago Public Schools
Figure 2: The new Morgan Station on the Chicago Transit Authority Green Line, which opened in 2012. Source: chicagotribune.com
Sadly, however, the policy tools designed to create a better city have rarely been used in an equitable fashion. Chicago’s broader gentrification pattern has also been influenced by its legacy of segregation established in the aftermath of the Great Migration that brought African-Americans north from rural Southern states over the first half of the 20th century. Early on, Chicago adopted a strategy of African-American avoidance, facilitated by its utilization of the above policy tools but also by the real estate industry, enforcement by police and even mob violence in city neighborhoods. This led to Chicago becoming a bifurcated city – a city segment which thrives in the areas where the usage of policy tools enforcing segregation was minimal, and one which lags because it has been starved of the investment that fuels growth elsewhere. Both facets will be explored in more detailed descriptions of the gentrification “waves”, below.
Chicago Gentrification Patterns
Perhaps even more than most, Chicago is a city of neighborhoods. The focus of this analysis is on those areas that either were working-class or low-income or became so, generally following World War II, and not those that remained steadily affluent and middle class.
If we understand gentrification to be the transformation of low-income or moderate-income urban neighborhoods into high-income urban neighborhoods, then Chicago could be understood to have had three completed iterations of revitalization that fits that description since the 1950’s, and is experiencing a fourth at this time. Local government policy, through specific local measures or local interpretation and implementation of state and federal policies, has played a significant role in moving the iterations forward. The iterations can be described in this fashion:
· The First Wave: The start of the transformation of the Loop and adjacent North Side lakefront neighborhoods, generally focused on the Near North Side and Lincoln Park.
· The Second Wave: The start of the transformation of areas inland from the Loop and North Side lakefront areas, into the Near West Side, Wicker Park, Bucktown and Logan Square, and the continued spread northward of gentrification into the Lake View and North Center areas.
· The Third Wave: The deepening or continued concentration of gentrification activity in all areas included in the first and second waves, with further northward expansion to include the Edgewater and Lincoln Square neighborhoods, westward expansion to include the Pilsen neighborhood, and southward expansion to include the Near South Side. This period is also characterized by scattered (and often failed) attempts to catalyze similar activity in areas further west and south.
· The Fourth Wave: Further concentration of gentrification activity in nearly all of the North Side lakefront, inland North Side, Near West Side and Near South Side where similar activity has already occurred, but slowly entering communities like Humboldt Park on the West Side, and the “Bronzeville” communities of Douglas, Oakland and Grand Boulevard on the South Side. This period is also characterized by significant “hollowing out” of areas further west and south, largely driven by the impact of the foreclosure crisis during and following the Great Recession, but also aided by local policy.
First Wave (1955-75)
Figure 3: Scene from Chicago's Lincoln Park neighborhood. Source: wikipedia.org
Chicago’s Near North Side, immediately north of the Loop, and Lincoln Park, adjacent to the Near North Side’s northern border and just three miles from the Loop, were among Chicago’s earliest recipients of gentrification activity. Historically both communities developed as working-class white ethnic enclaves in the early twentieth century, with Italians and Irish on the Near North Side and eastern Europeans in Lincoln Park. Following World War II, residents worried about the increasing deterioration of housing in both communities created new luxury housing in towers (Lincoln Park) and public housing in the form of the Cabrini-Green housing projects (Near North Side). Through the 1970’s and onward, both communities continued to from their former low-income status to high-income status. Today, both are among the wealthiest areas in the entire Chicago metro area.
Second Wave (1970-90)
Figure 4: The Edgewater neighborhood in Chicago. Source: choosechicago.com
As home prices and rents steadily rose in the Near North Side and Lincoln Park neighborhoods, people seeking similar areas started to broaden their search to adjacent areas. The Uptown neighborhood, perhaps the most diverse North Side community in the 1970’s with about 23 percent of its residents being persons of color in 1970 (most North Side lakefront neighborhoods were in the 3-5% range at the time), failed to get significant gentrification activity during this period, despite being adjacent to strong revitalization on all sides.
Third Wave (1985-2005)
Figure 5: Residences in Wicker Park. Source: bestchicagoproperties.com
In the third wave of Chicago’s gentrification, the gentrified areas became more so, and some activity moved into inland neighborhoods for the first time. Neighborhoods like Lincoln Park, Lake View and Edgewater went from gentrifying (transitioning from working-class to affluent) to fully gentrified (completing the process to becoming an affluent community). Incremental expansion of gentrification activity in other areas included the Pilsen neighborhood on the Near Southwest Side. The Near South Side gentrification represents the first venture of gentrification activity into the South Side.
Daniel Kay Hertz, a senior policy analyst for the Center for Tax and Budget Accountability in Chicago, a well-regarded urbanism blogger, and the author of the upcoming book The Battle of Lincoln Park: Urban Renewal and Gentrification in Chicago, essentially confirms the pattern of gentrification in the Windy City. “The general pattern of gentrification in Chicago has been to reclaim low-income, white ethnic communities as artist’s communities first, and then have them morph into affluent neighborhoods over time,” he said. “A lot of effort during that time was put into finding ways to contain the growing African-American population on the South and West sides, mostly to ‘protect’ middle class and working class communities and residents who might be inclined to take off for the suburbs.”
Fourth Wave (2000-present)
Figure 6: Recent residential development in Chicago's University Village area. Source: propecon.com
Chicago is currently in the middle of its fourth wave of gentrification activity. There continues to be affluence concentration in areas where gentrification started much earlier, particularly in places like Wicker Park, Bucktown and Logan Square, and slow movement into adjacent areas like Humboldt Park and Bronzeville (Douglas, Grand Boulevard and Oakland communities). Yet much, indeed most of the city was not effected, and, after the housing collapse, we witnessed the “hollowing out” of many West and South Side neighborhoods. Housing vacancies increased substantially in areas far from the strongest gentrification activity.
Figure 7: Chicago "Waves" of Gentrification. Map Source: Consortium of Chicago School Research
Data
The maps following this section document how the gentrification process has spread throughout Chicago. The data mapped includes changes in median household income by Chicago Community Area (CCA), beginning in 1990 and continuing through 2012-16. The data is taken from the U.S. Census and American Community Survey, from 1990, 2000, 2008-12 and 2012-16 (five-year estimates of ACS data).
Green CCAs represent areas with median household incomes that were higher than that of the Chicago urbanized area (the contiguous metropolitan development with a residential density of at least 1,000 persons per square mile) at the time. Yellow CCAs are areas with median household incomes that were higher than Chicago’s median household income, but lower than that of the urbanized area. Blue CCAs are those with a median household income lower than that of the city overall.
The 1990 map captures a snapshot of a Chicago that completed its first and second waves of gentrification, and is in the early stages of its third wave. Affluent census tracts on the 1990 map are concentrated in three areas – the far northwest side, the far southwest side, and the cluster of Loop, Near North Side and Lincoln Park areas on the north lakefront.
The 2000 map demonstrates how gentrification deepened along the north lakefront – how yellow moderate income CCAs turned green – and how it spread to adjacent inland areas. The Logan Square, West Town, Near West Side and Near South Side areas saw rapid increases in median household income between 1990 and 2000, thrusting them from working class status onto a path toward affluence. This impacted largely white ethnic enclaves in Chicago: Polish and Ukrainian in West Town, Norwegian in Logan Square, Italian on the Near West Side. Predominately African-American areas like the Douglas, Grand Boulevard and Oakland neighborhoods collectively called Bronzeville, did not see the same kind of revitalization.
Figure 8: Gentrified and Gentrifying Community Areas, 1990
Figure 9: Gentrified and Gentrifying Community Areas, 2000
Figure 10: Gentrified and Gentrifying Community Areas, 2008-2012
Analysis
One clear distinction between gentrification on the coasts and in Chicago lies in the fact that the city’s gentrification is notable for taking place largely within former working-class and low-income white ethnic areas, and avoiding largely African-American and Latino areas, irrespective of their income levels.
In its first and second waves on the city’s North Side, gentrification activity moved swiftly northward and inward from North Side lakefront areas. But by the start of the third wave in the 1990’s, the pace of expansion slowed significantly. During the third and fourth waves gentrification activity largely concentrated and deepened where it was already established, and expanded outward only when gentrified areas became saturated and reached a level of housing unaffordability.
Particular tools of public policy were used during certain waves:
Public housing construction, Interstate highway development and urban renewal in the first wave;
Targeted transit improvements and targeted city facility improvements in the second wave;
TIF districts, expansion of the magnet and charter school network, and deconstruction of public housing in the third wave;
School closures that aid in the “hollowing out” of neighborhoods in the fourth wave.
Much has been made by urbanist observers about Chicago’s population loss since the start of this century, putting it in stark contrast with other cities nationwide. However, an argument could be made that, if not for Chicago’s unique brand and pattern of gentrification, it would also show signs of population increase. This becomes evident when viewing this chart:
Figure 11: Chicago Population Change by Race/Ethnic Group, 2000-2016. Source: U.S. Census, American Community Survey
Chicago’s population has fallen by nearly seven percent since 2000, going from 2.9 million to 2.7 million over that time. Non-Hispanic white population dropped by nearly ten percent between 2000 and 2005, but have since rebounded to rise by nearly eight percent since 2005. The city’s Hispanic population has slowed somewhat since its boom in the ‘80s and ‘90s, but has still increased by seven percent since 2000. Asian population has seen astounding growth since 2000, increasing 37 percent. Yet Chicago’s African-American population has decreased by nearly 25 percent since 2000, virtually singlehandedly contributing to the city’s overall population loss.
An examination of median household income values by race and ethnicity shows that the growing prosperity of the city is not shared equally, either:
Figure 12: Chicago Median Household Income Change by Race/Ethnic Group, 2000-2016. Source: U.S. Census, American Community Survey
Overall, Chicago’s median household income (all in actual dollars) rose from $38,000 to $53,000 between 2000 and 2016. For non-Hispanic whites, that figure grew by 56 percent, from $47,000 to $73,000. Asian households saw the largest gain at 61 percent, rising from $41,000 to $65,000. Hispanic households witnessed a 34 percent gain in median household income, rising from $37,000 to $49,000. Median household income for African-American households, however, remained virtually unchanged over the period, rising just six percent – going from just $29,000 in 2000 to $31,000 in 2016. The inference here is not that the incomes of African-Americans are stuck in neutral; many more middle class African-Americans have simply moved elsewhere, to the suburbs or to other locales.
Chicago Gentrification Today: A Tale of Two Very Different Cities
Figure 13: Construction of the 1345 Wabash condo tower, in 2015. Source: yochicago.com
Tour Chicago today, and you would find construction cranes dotting the prairie landscape from the South Loop to the North Shore. Indeed, for the third year in a row Chicago ranks second to Seattle for the number of construction cranes in major American cities. Office and residential towers are sprouting up near the lakefront, taking advantage of wonderful lake views and easy access to one of the world’s most dynamic downtowns. Like what one would find in Brooklyn or Seattle, Chicago is witness to the same kind of gentrification controversies that mark the superstar cities.
However, one doesn’t have to go far to find evidence of disinvestment and neglect. A scant two or three miles south of the Loop, or just two or three miles inland from Lake Michigan, and one will come across neighborhoods full of vacant lots, abandoned or distressed buildings, and a sense of resignation and frustration from residents.
These divergent patterns can cause conflict. In the Pilsen neighborhood on the city’s Near Southwest Side, one of the city’s oldest neighborhoods, and once a pillar of Eastern European immigration, and later a destination for Latino immigrants in the 1950’s and 1960’s.
Jose Requena is a graduate student studying urban planning and public policy at the nearby University of Illinois-Chicago (UIC), and a volunteer community organizer for Pilsen Alliance. Pilsen Alliance was formed in 1998, in reaction to encroaching development in the area from the aforementioned UIC and the creation of a TIF district to stimulate development. Requena has been with Pilsen Alliance since 2016.
Figure 14: Scene from Chicago's Pilsen neighborhood. Source: wikipedia.org
“University Village is where I first experienced and understood gentrification in Chicago,” said
Jose Requena , a graduate student studying urban planning and public policy at the nearby University of Illinois-Chicago (UIC), and a volunteer community organizer for Pilsen Alliance. “It’s where I learned that gentrification isn’t just someone’s idea, it’s a long-term real estate scheme. It’s a 40-year process.”
Starting in the 1990’s UIC sought to take a lead role in redeveloping the area to match its own perceived character – townhouses and condos that would be attractive to university faculty and staff and other professionals, with updated amenities to boot. University Village would eventually replace the largely working-class homes of the area, as well as the Maxwell Street market and bazaar. Maxwell Street was the home of Jane Addams’ Hull House, and later became the place where the Chicago Blues sound originated. In the process, much of Chicago’s most precious heritage was lost.
Figure 15: CTA Pink Line Damen Station, in Pilsen. Source: wikipedia.org
Today, Requena and Pilsen Alliance members are concerned about development patterns in central and western Pilsen, much of it based around the Chicago Transit Authority’s Pink Line in 2006, which enabled a 100% increase in rush hour transit service on an upgraded “L” line.
According to Requena, “TOD (transit-oriented development) is being used against neighborhoods. Don’t get me wrong, I enjoy and prefer public transit. But the way the city targets its transit investments, it essentially encourages developers to harvest the profits of the surrounding land.”
Figure 16: Aging greystone next to new development in Kenwood Oakland. Source: yochicago.com
Yet outside of Pilsen many neighborhoods appear more abandoned than targeted for gentrification. Nearby Kenwood Oakland, gained notoriety for being the home of former president Barack Obama and family, and has long s been the home for many affluent and professional class residents. But just north of 47th Street, we encounter struggling commercial corridors along Cottage Grove Avenue and 43rd Street, and public housing complexes like the former Ida B. Wells Homes. Vacant lots are scattered throughout the northern half of the community, and have been for decades.
Jawanza Malone, executive director of the Kenwood Oakland Community Organization (KOCO), believes the north/south difference in Kenwood-Oakland was deliberate. “This isn’t natural; this was created,” said Malone.
Figure 17: New construction adjacent to vacant land in Kenwood Oakland. Source: jamesiska.blogspot.com
Malone is a firm believer in “displacement by disinvestment” – the process of driving residents and businesses out of a community, driving prices downward, and setting the stage for future development.
Malone cites the Chicago Housing Authority’s Plan for Transformation, which saw the demolition of thousands of public housing units on the South Side in favor of limited mixed-income housing development, and the round of school closures in 2013. He’s currently wary of the development potential of the former U.S. Steel South Works site, an expansive (600+ acre) development site that could add as many as 20,000 housing units on the south lakefront. Development is currently stalled, but the megaproject has received considerable city assistance – site acquisition, demolition, environmental cleanup and more – since the late 1990’s.
Malone has also been involved in the debate over the development of the proposed Obama Presidential Center in the Woodlawn neighborhood, about two miles south of Kenwood-Oakland. Activists like Malone have been pushing for the Obama Foundation to agree to a community benefits agreement with community stakeholders, in an effort to mitigate against the higher property values and rents they believe will come from the development. Obama Foundation officials say they don’t believe the presidential center will have a displacement impact; activists like Malone say it already has.
Figure 18: Two-flats in Chicago's Roseland neighborhood. Source: estately.com
Many neighborhoods like Chicago’s Roseland community, about five miles south of Kenwood-Oakland and ten miles south of the Loop, have become poorer, with the loss of steel and automative jobs.
Abraham Lacey and Janece Simmons are the executive director and director of workforce development and regional housing strategies, respectively, for the Far South Community Development Corporation on Chicago’s South Side. They express a concern that the cities use of TIFs ---- starved essential services, like schools.
“I feel like the school closures by CPS (Chicago Public Schools, in 2013) was an outcome of TIF policy,” said Lacey, referring to the decision by the school system to close 54 schools citywide that year, mostly on the South and West sides. He went on, “many were in fact underperforming and underutilized, but the schools were starved for investment. CPS just didn’t have the resources to make the improvements residents wanted…the lack of investment is often viewed as a perceived lack of importance to the city. It’s a signal that residents here aren’t as important.”
The Bifurcated City
It’s becoming clearer that Chicago’s divided nature is hardly a new phenomenon. Marisa Novara, vice president of Chicago’s Metropolitan Planning Council, says that the city’s divided nature is nearly as old as the city itself. Novara led MPC’s two-pronged effort over the last two years, in partnership with the Urban Institute, to examine Chicago’s segregation: The Cost of Segregation, which quantified differences in wages, housing costs, educational attainment, crime and even lives lost due to segregation, and Our Equitable Future, which outlined policies that would effectively reduce the city’s strong segregation patterns.
The first phase of the MPC/Urban Institute project brought segregation into jarring focus. Researchers sought to answer two questions: 1) What does it cost metropolitan Chicago to live so separately from each other by race and income? 2) What can we do to change these patterns of segregation, so that everyone living in our region can participate in and create a stronger future? Their research found that if Chicago’s level of segregation were at national median levels, it would result in:
An overall increase in total regional income of $4.4 billion, led by a $2,982 rise in income for African-Americans, per person, per year;
Chicago’s homicide rate would likely drop by as much as 30 percent, saving 229 lives;
As many as 83,000 more people would have bachelor’s degrees.
As for segregation’s impact on the city’s residential patterns, Novara said, “there’s a real disconnect in knowledge across city neighborhoods. Affluent residents aren’t aware of affordable options in parts of the city they don’t typically visit, and low income residents may not be aware of employment opportunities that go unfilled in affluent areas. Some low income residents may even resist going to affluent areas, for fear of negative interactions.”
The challenges of Chicago’s persistent segregation are often lost on many of the city’s affluent residents, who view Chicago as more diverse and inclusive than any time in its history. And for many it’s absolutely true, but gentrification appears to be widening the divides. Daniel Hertz notes that “Chicago’s north lakefront was once exclusively a white ethnic, working class bastion, but it’s become more diverse as it’s become more affluent.” Chicago, Hertz notes, is at a demographic crossroads. “The inventory of old white ethnic enclaves in pre-World War II neighborhoods is drying up, and it’s uncertain whether developers or residents are ready or willing to move into less familiar areas.”
This is of course a national issue, as suggested by Richard Rothstein, a Senior Fellow at the Haas Institute at the University of California, Berkeley School of Law, and author of The Color of Law: A Forgotten History of How Our Government Segregated America, which examines the history of segregation in the United States, particularly as it relates to housing.
In his book Rothstein notes how public housing construction authorized by the Housing Acts of 1937 and 1949 was used to segregate American cities, including Chicago. The federal government guaranteed low-interest loans to finance the development of new homes on the urban periphery, but African-Americans were excluded at every level: homebuilders explicitly excluded them from purchasing homes in burgeoning suburbia, and provisions of the G.I. Bill that offered mortgage financing weren’t offered to them. In an interview with the New York Times Rothstein said, “We have created a caste system in this country, with African-Americans kept exploited and geographically separate by racially explicit government policies. Although most of these policies are now off the books, they have never been remedied and their effects endure.”
The residue of the policies meant to contain African-Americans in the Rust Belt remains to this day.
The Coming Wave?
Chicago’s current trajectory is likely to heighten bifurcation, essentially becoming a wealthier city in some cases, yet a poorer one overall. Although they are not imminently likely to gentrify, we are likely to see the continuing emptying of West and South Side neighborhoods, further driving up racial and economic inequality while some gentrification activity into previously untouched areas on the West and South sides.
Chicago could be heading toward a future of more “displacement by disinvestment”.
Between 2000 and 2015, five largely African-American South Side communities, Englewood, West Englewood, Greater Grand Crossing, Chatham and Roseland, and four largely African-American West Side communities, East Garfield Park, West Garfield Park, Austin and North Lawndale, lost one-fifth of their population, from a combined 417,000 in 2000 to 335,000 in 2015. The population loss was most acute on the South Side: the population of the five South Side communities fell by 23 percent.
Figure 19: A vacant home being prepared for demolition in Chicago's Englewood neighborhood. Source: dnainfo.com
Figure 20: Vacant lots dot the landscape of Englewood and other South and West Side Chicago communities. Source: openlistings.com
It’s clear that any city that underwent significant “displacement by disinvestment” would be marked by severe racial, ethnic and economic inequality. Affluence would likely be concentrated in certain pockets of cities, while poverty would occupy larger parts of cities and metros than they do today. Few middle class communities, and the jobs that support them, would be apparent.
Although this development pattern is clearly recognizable in Chicago, many other cities nationwide show traits of affluent clustering at the same time poverty expands. Cleveland, Detroit, Milwaukee, St. Louis, Baltimore, Philadelphia and others have varying degrees of the development pattern.
Conclusion: A Better Way for Chicago
Figure 21: Aerial view of Chicago, as seen from the Hyde Park neighborhood. Source: yochicago.com
In 2012, the international Organisation for Economic Co-operation and Development (OECD) published a territorial review of the Chicago metropolitan area, the first such done in the United States. The report identified many strengths for the region; it’s an affluent and well-educated region with a diversified economy. But the region suffers from a serious skills mismatch that stymies economic growth, and as a result underperforms economically relative to its strengths. The report says that persistent unemployment, particularly in the region’s African-American and Latino communities, made worse by spatial segregation, plays a significant role in the region’s underperformance. The report received little public recognition, perhaps because Chicago’s political and business leaders were critical of the conclusions.
Chicago follows a different path than many of the nation’s “superstar” cities, or its Sun Belt fast-growth brethren. The city’s population continues to fall, but new commercial and residential towers continue to rise. Economic inequality is deepening as poverty becomes more entrenched, yet overall city income is rising as more and more affluent residents move in. Violent crime continues to plague vast segments of the city, but its affluent neighborhoods are as safe as similar neighborhoods in New York City, making them among the safest urban areas in the world. Chicago’s split personality makes it difficult for easy or simplistic characterization.
Although there has been some notable growth in the core city, nothing has occurred to alter the pervasive lack of inclusive growth. This heightens racial and class tensions while putting a ceiling on the city’s potential. Chicago, like the rest of America, needs to do better.
But it may be the case that social and cultural factors might have as much influence on the expansion of revitalization in Chicago as do economic ones. Clearly, the city’s legacy of segregation influenced where early gentrification would start, and has determined how it would expand, once started. It’s also clear that the city’s usage of its public policy tools influenced the where and how of gentrification, and continues to do so today.