

More On Cities And Distressed Neighborhoods
Examples of how metro areas hide the distressed parts to keep us looking at the prosperous ones.

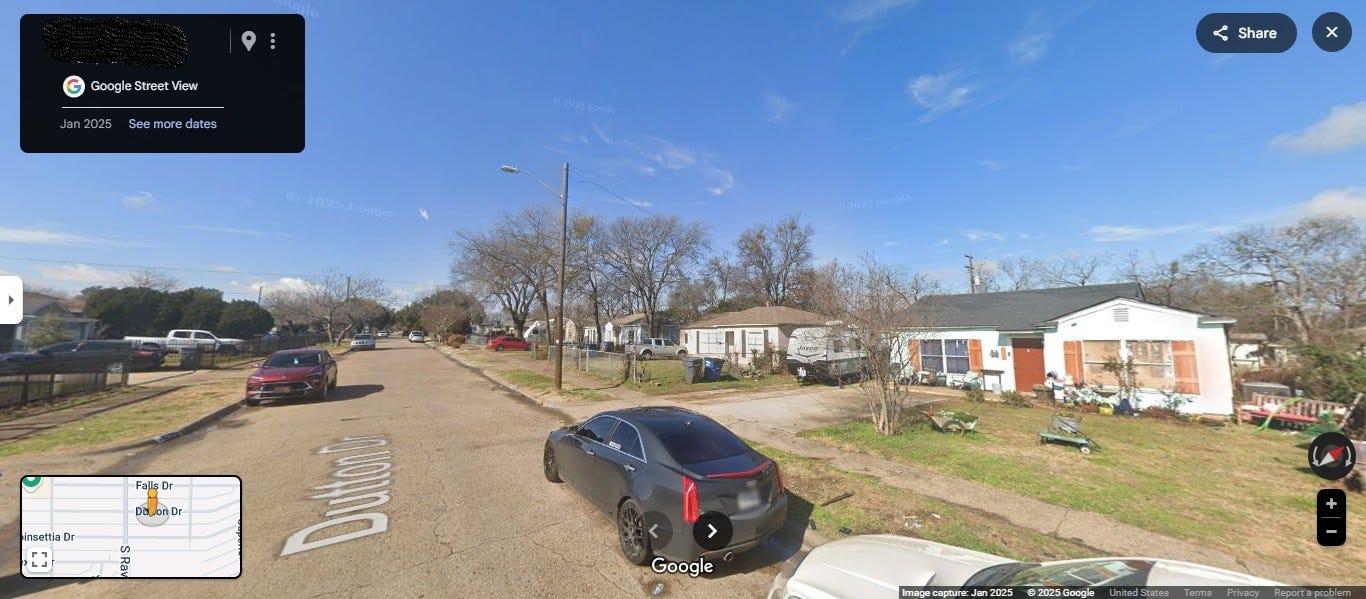
A residential street view of a neighborhood in South Dallas. Few people associate neighborhoods like this with Dallas, choosing to focus on its revitalizing interior or booming outskirts. But neighborhoods like this exist there, and a big part of the Metroplex’s success is hiding this view from outsiders. Source: google maps
It’s time for me to follow up on the post I wrote ten days ago in response to fellow planner and Substacker Bill Fulton’s "garlic knot" cities concept.
Here’s a quick summary. Fulton notes in his article that there are metro areas across the country anchored by core cities that have solid and successful downtowns surrounded by quickly rising close-to-downtown neighborhoods and growing suburban areas further out. However, many have struggling neighborhoods in between the downtown and suburbs, either awaiting the boom that revitalized downtown or becoming recognized as a great alternative to suburbia. Here’s how he put it, after being reminded of this while spending time in Baltimore’s Inner Harbor:
“Not all of Baltimore, of course, is like this. Like many older rust belt cities that have lost population – Philadelphia, Detroit, Cleveland – the suburbs are still growing and the center is getting very strong, but the old city neighborhoods are in rough shape. A mile away from where I was enjoying a high-amenity experience, people are trapped in neighborhoods of extreme poverty.
We used to call places like Baltimore and Detroit “donut cities,’ because there was nothing left in the center. But after decades of both public and private revitalization efforts, they’re not really donuts anymore. Some time ago, the Christian urbanist (no, that’s not an oxymoron) Aaron Renn called them “The New Donut,” but that term doesn’t quite fit either.
Instead, I’d call them Garlic Knot Cities – very dense and satisfying in the center, but the center is small and doesn’t have much of substance surrounding it.”
It’s an astute observation, and one I’ve noted as well (without any cool name for it). I think it stands out as one of the most pressing issues of urban planning, policy and governance today, yet it’s almost never framed in this way. There are loud voices in cities advocating for new housing, so housing becomes more affordable. Meanwhile, the machinery that has supported the growth of suburbia continues to build more on the periphery of metro areas. Sun Belt metros, particularly in Texas and Florida, remain locked in on the suburban model. The middle neighborhoods, unfortunately, get left out of the discussion.
Why is this? Mostly because that’s where a significant chunk of urban distress is housed in American cities. These are the areas noted for high crime, poor quality schools, abandoned or obsolete housing, limited access, lacking in amenities, few job opportunities and other ills that plague cities. Residents of these neighborhoods are often looking for the kind of substantial public investment that turned downtowns around, or the private investment that boosted neighborhoods that were once very similar to them into attractive hip hotspots.
But these neighborhoods inhabit a different space than the revitalized downtown and the still-growing suburbs. Back when the term “donut cities” did make sense, cities realized the importance of strengthening the center. In came the new stadiums, mixed-use developments, institutional expansions, and a new commercial ecosystem to support them. And it worked. As I mentioned earlier, the suburban model keeps chugging along, even in weak metro economies. Without the appeal of being a metro area’s showroom to the world, or a metro area’s next shiny new thing, those in between continue to lag.
The link between race, age of development form, and perception
In my response to Fulton’s piece, I argued that race and the general age of a metro area’s development form played a key role in this. I won’t go into depth into this here; you can check out the link above for more detail. But bottom line, I found some interesting relationships between how older and newer metro areas, and metros with low Black populations versus high Black populations, developed perceptions that contributed to the social and demographic organization of each metro area.
I finished that piece by saying that metro areas have found ways to organize distressed communities within them. I noted three key ways metro areas organize distressed areas within them – 1) scattered distress, where distress neighborhoods can be found in many places, both within and outside of a core city; 2) wedged distress, where distressed neighborhoods are “wedged” into a specific portion of a metro area, often moving beyond core city boundaries; and 3) contained distress, where distressed neighborhoods are almost wholly contained within the core city’s boundaries.
Quantifying community distress
I know that’s a lot to digest and you’re probably wondering where this is going; here’s where I connect the dots. The first question one might have is what an actual definition for “distressed neighborhoods” would be. Fortunately, the Economic Innovation Group, a “bipartisan public policy organization dedicated to forging a more dynamic and inclusive American economy,” has been keeping track of distressed neighborhoods with its own definition since 2015. The Distressed Communities Index has been EIG’s signature research tool since the organization was founded 10 years ago and is updated regularly. The DCI uses seven key indicators to assess the economic health of zip codes, grouping them into quintiles: prosperous, comfortable, mid-tier, at risk and distressed.
The seven components of the index are:
· No high school diploma: Share of the 25 and older population without a high school diploma or equivalent.
· Housing vacancy rate: Share of habitable housing that is unoccupied, excluding properties that are for seasonal, recreational, or occasional use.
· Adults not working: Share of the prime-age (25-54) population that is not currently employed.
· Poverty rate: Share of the population below the poverty line.
· Median income ratio: Median household income as a share of metro area median household income (or state, for non-metro areas and all congressional districts).
· Changes in employment: Percent change in the number of jobs over the past five years.
· Changes in establishments: Percent change in the number of business establishments over the past five years.
There are two things that EIG has done consistently with DCI since its release. It’s used the same indicators and quintiles from the beginning, and it’s produced a nationwide map of zip codes that illustrate the quintiles at the metro area level. In other words, we can use their mapping as a way to identify scattered, wedged and contained distress at the metro level.
How do scattered, wedged and contained distress look? Let’s pull some screenshots starting with scattered distress. Earlier I noted the New York metro area as one with scattered distress. Here’s how it looks:
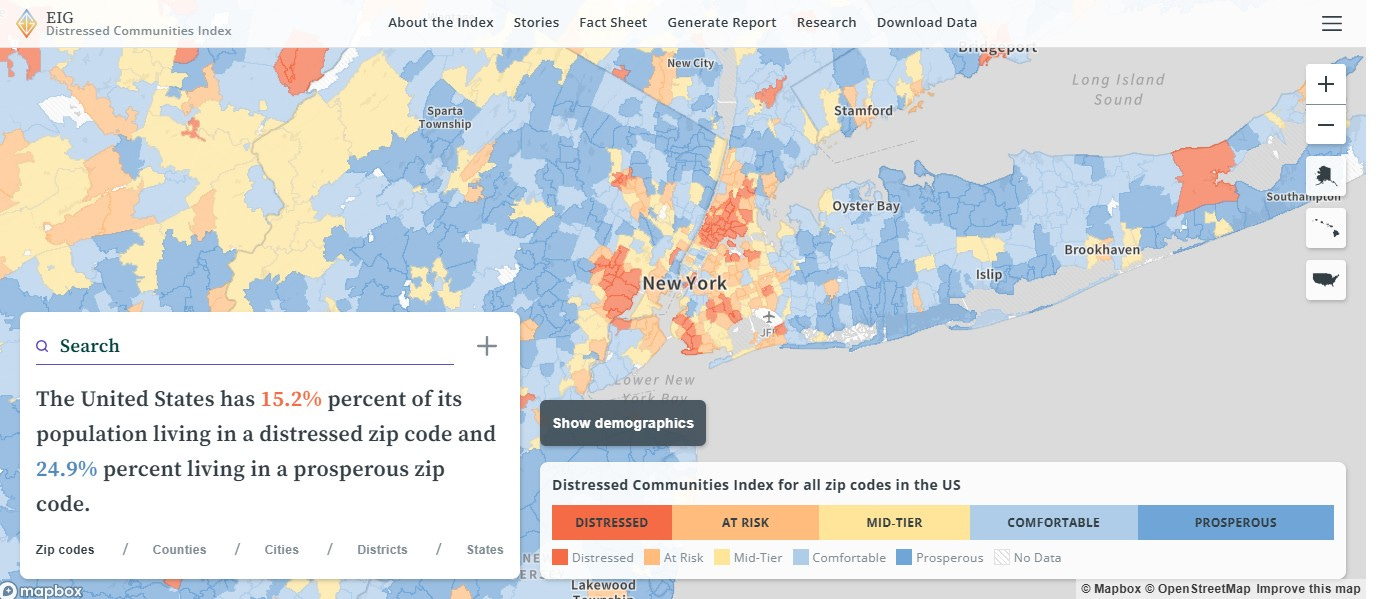
The distressed parts of metro New York are pretty dispersed across the region. Manhattan is largely a gentrified core, but distressed areas appear in Harlem and northward into the Bronx. To the west, Newark and some other communities show up as distressed in New Jersey, and distressed areas also appear to the south and southeast in Brooklyn and Queens, respectively. It seems the San Francisco Bay Area, Atlanta and Miami are similar in profile.
Now let’s look at Chicago, perhaps the clearest example of the wedged distress profile:
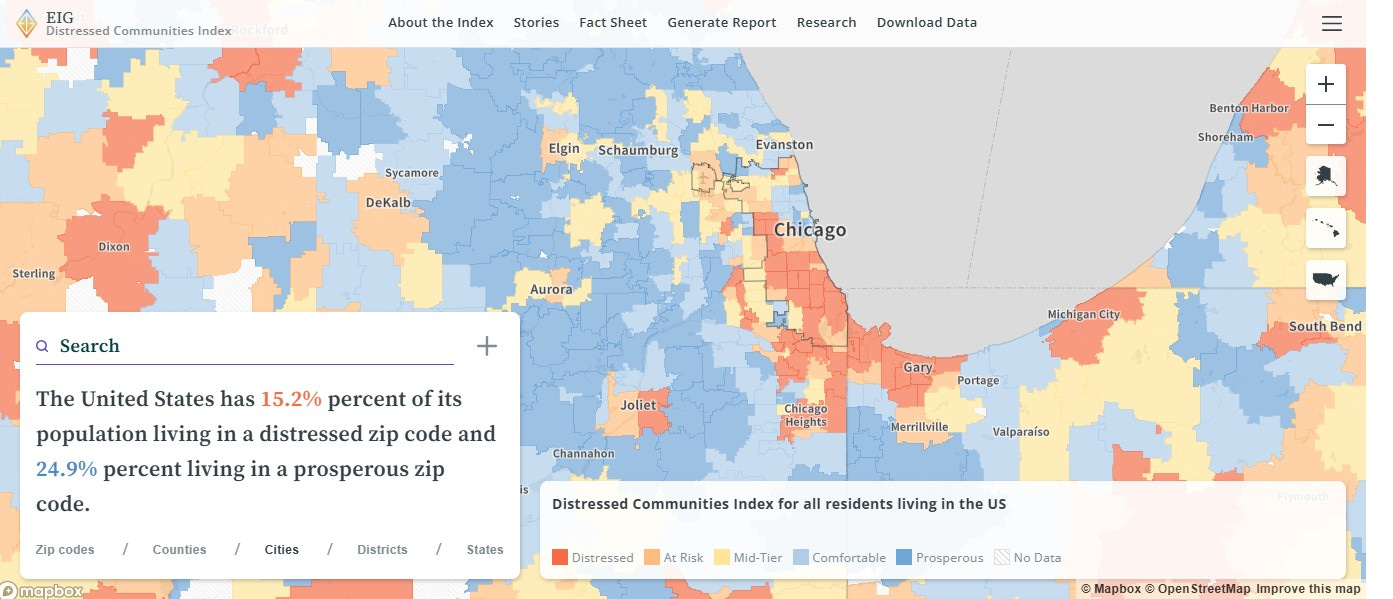
Unlike New York, Chicago has a pretty extensive concentration of distressed communities that start on the city’s West Side and stretch to the southeast to include much of the South Side, the suburbs south of Chicago in Illinois and into northwest Indiana. Distressed communities extend beyond Chicago’s boundaries to include adjacent suburban areas. Other metro areas that might fit the wedged distress profile are St. Louis (wedged into the metro area’s northern third) and Dallas/Ft. Worth (the southern quarter of both cities).
How does contained distress look? Let’s try Memphis:
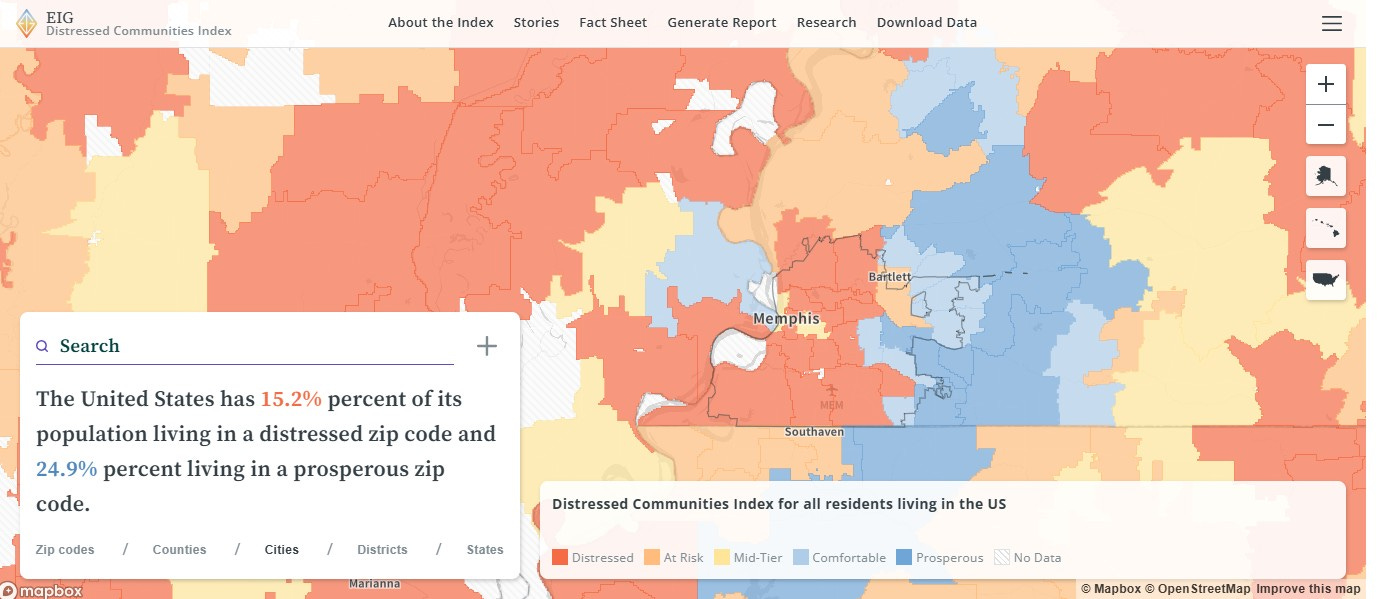
As a smaller metro area, there are rural distressed communities not far for Memphis’ city boundaries. Distinctly urban distress, however, is concentrated in Memphis and West Memphis, AR, immediately west of the city. Larger metros that fit the same profile would include Detroit and Cleveland.
Perception is reality
You might be asking, “how does where distressed neighborhoods exist formulate our perceptions of cities and metro areas?” In a word, bigly. New York isn’t comprised just of the eight million people living in the five boroughs, but an additional twelve million over several states. Their perceptions matter in small things like where someone might feel comfortable going for food or entertainment. It also applies to larger matters like New York’s congestion pricing program implementation, when the city relies on state legislation and the cooperation of non-city residents to improve governance and services. The same goes for every metro area, no matter how large or small.
In a metro like New York, a scattered profile might give residents the sense that distressed communities are around if not necessarily pervasive. Non-city residents develop a more symbiotic perspective and relationship with the city, leading to a give and take between the city and its surrounding suburban areas. A metro with a wedged profile, like Chicago, might develop a distinct “two cities” profile, with people on either side of the divide advocate fiercely for the policies they favor. Cities like Memphis, Detroit and Cleveland, however, struggle even more because a significant portion of their suburban residents have written off the city entirely, and there are real challenges to building the kind of regional coalition needed to revitalize all parts of the city.
In Tom Wolfe's "The Bonfire of the Vanities," the phrase "insulate, insulate, insulate" is used to describe the social and emotional distancing one must practice to survive in 1980s New York City. It's a cynical view of the city's social dynamics, where Rawlie Thorpe suggests that to truly live in New York, one must insulate themselves from the complexities and negativity of the city and its inhabitants. We have a U.S. president now who has become the insulator-in-chief through his mass deportation efforts and depictions of lawlessness and corruption in cities and states governed by Democrats. But as I’ve said before, there is no insulation without isolation. The problems don’t go away because you choose not to acknowledge them anymore.
This is very insigtfull, and thanks for the link to a great mapping tool!
While some regions such as Los Angelas and even St Louis or Baltimore to an extent are hybreds (Baltimore has a nerrow better off north side corrador connecting downtown and the suburbs), even then all major US metro regions seem to at least mostly fit into one of these 3 patterns. This reminds me of the notion of metro area "favored quarters" (that you and others have written about in the past) within wedged distress regions like Chicago or Dallas (also favored belts and edge cities in contained destress regions).
Just as the Chicago metro has a disfavored wedge of distress heading south that has overtaken former midscale areas all the way to exurbia, it also has an especially favored and upscale wedge heading northwest, almost opposite from its unfavored wedge, with more "average" middle and working class areas in the suburbs largely located in between. Atlanta and Washington, DC seem like other extreme examples of wedged distress regions beyond their revitalized/gentrified downtown cores.
Gotta say, the wedged distress visable in the Chicago region map is rather breathtaking in its extent!
These are excellent analyses