More On Rust Belt to Sun Belt Migration
Just one of my regular reminders to Sun Belt residents - nothing lasts forever.
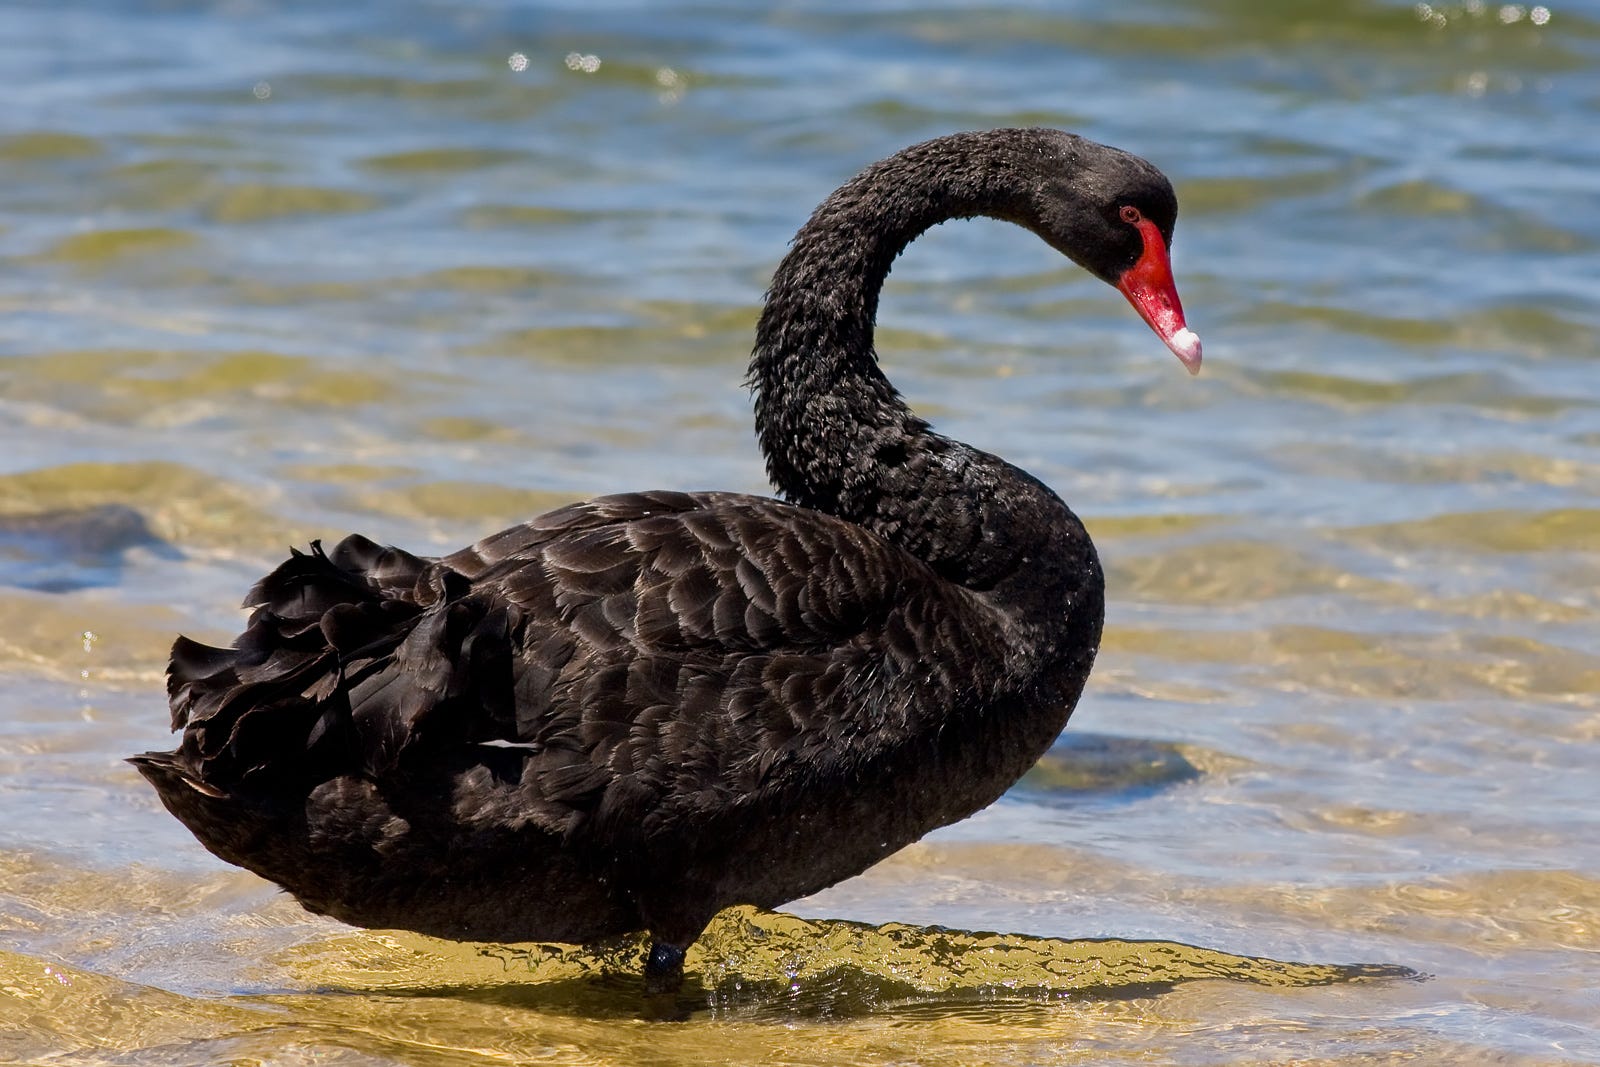
A black swan in Australia. Black swans were presumed not to exist until Dutch sailors saw some in Australia in 1697. Source: wikipedia.org
Three weeks ago I wrote a piece about the role that a “Rust Belt Diaspora,” or the people who relocated from Rust Belt to Sun Belt states over the last 50 years, could play in Rust Belt revitalization. In that piece I noted that there are many people who seek to maintain a connection with where they (or their parents) used to live, and that’s partly expressed by fan support in major professional sports leagues. I used the example of Detroit Lions fans nearly equaling the number of hometown fans in Phoenix, Houston and San Francisco last season, reckoning that they weren’t all traveling from Michigan to see the Lions.
Also in that piece, I did a back-of-the-napkin estimate of Rust Belt to Sun Belt migration from 1970-2020. My estimate, if accurate, would outpace any significant domestic migration pattern ever seen in the U.S. – dwarfing the Great Migration, Dust Bowl, perhaps even America's westward expansion following the Louisiana Purchase in 1803 and continuing for the next century.
It’s worth posting here again so you can understand the scope:
_________________________
For the past few weeks I’ve been trying to find research that quantifies Rust Belt to Sun Belt migration. Seems to me there’s an academic or PhD candidate who wrote a paper on the outflow of residents from the Northeast and Midwest to the South and Southwest from, say, 1970-2020, but I haven’t found it. So I decided to make a crude estimate. Let’s see how it works.
I set out to look at population growth figures for all 50 states between 1970-2020. I classified all 50 states by what I determined to be their Rust Belt, Sun Belt and non-Rust/Sun Belt type. Using my judgement I categorized 13 states as Rust Belt, 15 states as Sun Belt, and the remaining 22 as neither. You can see how I designated them on the map below. It’s one version of a Rust Belt/Sun Belt framing at a state level; your map may look different:
My next step was to analyze decennial population growth for the designated Rust Belt and Sun Belt states, and compare their growth rates with the total growth rate of the U.S. over the same period. In this step I found that between 1970-2020 the total population of the U.S. grew by 63%, from 203.4 million to 331.4 million. That works out to a 10.3% increase per decade.
Of course, we know that the nation’s growth wasn’t distributed equally, so I grouped the states by their designated categories and analyzed their growth rates. The Sun Belt-designated states grew by 119% over the same period, averaging a 17% increase per decade. Non-Sun/Rust Belt states grew by 67% over the period. Their growth rate of 10.9% per decade is essentially the same as the 10.3% rate for the U.S. overall. The Rust Belt states? They grew by just under 19% between 1970-2020, or about 3.5% per decade. This table shows how each category grew by decade:
Should be no surprises here. The fifteen Sun Belt states significantly outgrew the 13 Rust Belt states over the entire 50-year span. The greatest differences occurred during the 1970-1990 period, when Sun Belt states were growing at nearly 11 times the rate of Rust Belt states. Sun Belt population growth slowed from the 1990s onward, and Rust Belt population growth moved upward slightly over the same period. However, it looks like Sun Belt states grew by nearly five times the rate of Rust Belt states, for a 50-year period.
For me, going beyond this to accurately estimate the number of people involved in a Rust Belt to Sun Belt migration between 1970-2020 would be a fool’s errand; I’d defer to anyone who’s researched this or has the statistical chops to figure it out. There are too many other variables to account for, like differences in international immigration numbers by state, or birth rates and death rates by state.
But the next analytical step I took started with a simple question – what would the population of each state be if all states grew at the same national growth rate of 10.3% per decade from 1970-2020? Starting from the 1970 population base, I estimated that today’s Rust Belt states would cumulatively have about 41 million more people than in 2020. The Sun Belt (-39.7 million) and the non Sun/Rust Belt states (-1.7 million) would be smaller.
_________________________
Now, I’m not saying that 41 million people left Rust Belt states for the Sun Belt. There’s natural growth and international immigration to consider. But even if the number of people moving from Rust Belt to Sun Belt was on the order of 10 million, assuming the remainder comes from natural growth and international immigration, that would be an astounding figure.
Strange thing, though – I looked for academic research on north-to-south domestic migration during the 20th and 21st centuries, and I found… nothing. I’m sure there’s something out there, but I haven’t found it yet. I’m still seeking comment from anyone who can point me to good info on this topic.
Why is this so hard to find? One thought is that this domestic migration pattern has become conventional wisdom. When the tide began to turn away from northern states in the 1980’s, the topic did get lots of attention. In the 1990’s and 2000’s, Rust Belt to Sun Belt migration began to impact presidential elections through changes in the Electoral College. At some point it just seemed to be the natural order of things in America.
But is it really?
thanks, Pete. this exploration is quite interesting. You might find more data and analysis by comparing cities (being careful to separate cities from metros for consistency). The numbers are pretty dramatic. Some cities peaked much earlier than is usually associated with deindustrialization. The population of East St. Louis peaked in 1910, Buffalo in 1950, to give a couple of examples. What pundits and academics don't ask often enough is why did ALL these cities and states lose their industry base? That undermines the much-repeated thesis that industrial cities were poorly run, crooked, etc. The consistency of the trend not just the longer time horizon points to national trends and not so much to individual state and city trends. That allows useful theorizing which is really important as pundits talk of reindustrialzing.
I don't understand why you choose to use the term Rust Belt like this. I hear it as a pejorative and it's like when someone says "the Democrat party". I would never say "I'm from the Rust Belt" and I only use the term when I'm talking about a crummy town I don't like that I quickly want to communicate a negative sentiment about. Beyond that, what exactly is Rust Belt-y about Iowa and Minnesota?
It's just hard to take a piece seriously when it's used as you use it here. Like calling the Southeast the Cockroach Belt. It may be true, but it's clarifying.