Breaking Down Metro Areas Into Bite-Sized Pieces
More metro areas could stand to learn much more about themselves, at finer levels. It will uncover things that will have to be addressed later.


The Chicago metro area looks like this, but it’s not lived like this by its residents. Source: gettyimages.com
OK, today I’m going to do something a little different. I’m going to take a trip into a geeky, maybe even esoteric statistics/demographics rabbit hole. Please stick with me here because I think many metros lack the tools that can unlock new understanding of place by employing something I’ve taken for granted by being in the Chicago area for so many years.
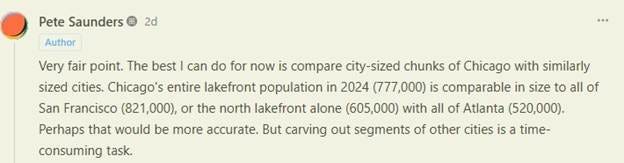
This thought hit me when a comment to last Thursday’s post brought up an interesting point. Subscriber Michael Lewyn agreed with my overall analysis, but realized the apples-to-apples comparison wasn’t there. Here’s a screenshot of his comment below:

Immediately I realized he was right and responded with this:
But the rest of my comment included something I’d taken for granted about the Chicago metropolitan area. I realized that metro Chicago planners, demographers, economists, public policymakers, and many other groups have access to something that’s not replicated elsewhere in the U.S.
Or put another way, it’s easy to study and analyze sociological phenomenon in an urban context in Chicago because it’s easier to find the data at subarea levels, like neighborhoods or communities. It’s been that way since here for a century. Few metropolitan areas have deep historical data that allows us to understand how neighborhoods and communities once looked and functioned a century ago, and compare the data at the same level today.
Chicago can thank the Chicago School of Sociology for that.
Chicago has a tool other cities and metros could use
The rest of my Substack comment references the work that began at the University of Chicago in the 1890s and made the university the “epicenter of advanced sociological thought between 1915 and 1935”, according to Wikipedia. Instead of another screenshot, I’ll include what I said here as a quote:
“Chicago has been gathering data by its officially designated Community Areas since 1920, when University of Chicago sociologists Robert Park and Ernest Burgess sorted 1920 Census data by 75 Community Areas. UChicago published a decennial Local Community Fact Book following the 1930 Census and continued through the 1980 Census. The Community Areas boundaries have remained almost entirely consistent since their beginning, with two exceptions: the annexation that led to O’Hare International Airport led to the establishment of the O’Hare Community Area (#76), and the Uptown Community Area (#5) was split in 1980 to create the new Edgewater Community Area (#77) when wealthier north Uptown residents wanted to contrast themselves from less-wealthy south Uptown neighbors. UChicago stopped publishing the decennial Local Community Fact Book in 1990, but in 2000 and 2010 it was picked up by local nonprofits.
Since 2015 the Chicago Metropolitan Agency for Planning, metro Chicago’s MPO, has compiled annual Community Data Snapshots for its entire planning area -- for each of its 7 counties, 284 municipalities, and each of the 77 Community Areas in Chicago itself. Data is compiled by ACS five-year estimates, and compared against previous five-year estimates. I think it’s an amazing tool that lets people see granular changes that otherwise get little notice.
I know this because I contributed to the development of the Community Data Snapshots when I worked at CMAP in the 2010s. I do know other agencies in other cities and metro areas analyze regions in a similar fashion, but I don’t know if any other city or metro has such a long and consistent subarea analysis as metro Chicago has.”
I’ll show you what I mean by linking four CMAP Community Snapshot examples – at the county, core city, suburban municipal and Chicago Community Area levels:
Suburban Municipal Snapshot Example (Skokie)
Chicago Community Area Snapshot Example (Morgan Park)
I won’t bore you by detailing the immense amount of data in each profile. However, the information covers six key data areas – population and households, housing characteristics, employment, land use, tax base (for county and municipal jurisdictions only) and change over time (comparing the most recent ACS five-year estimates with the 2000 Census and the 2010-2014 ACS).
Like I said earlier, I participated in the early efforts to produce early community snapshots when I was working on CMAP’s Local Technical Assistance Program. At the time I led a team of planners that were engaged in providing free planning assistance to municipalities in the Chicago area, funded by a 2010 three-year grant from the U.S. Departments of Housing and Urban Development and Transportation. During the first three years of the program CMAP completed some 40 comprehensive plans, neighborhood plans, corridor plans, transit-oriented-development plans, sustainability plans, zoning ordinance updates, and more.
Over the years the program has been scaled down somewhat to narrow its focus. In the years since, CMAP staff has focused on specific project types during their annual call for projects. And instead of doing solely in-house work, CMAP now sources many of the projects to outside consulting firms.
The results over the years have been fantastic. For CMAP’s purposes, it was an opportunity to influence communities, at all scales, to engage in planning. During the program design process, we found that many municipalities in the Chicago area had last completed comprehensive plans and zoning ordinance updates in the 1950s. It was also viewed as a chance to align local planning goals with the regional GO TO 2040 Plan it released in 2010, and later the ON TO 2050 Plan that was released in 2018 and updated in 2022.
When I started at CMAP in 2010, I thought one of the agency’s best decisions was to build on the work of the Chicago School sociologists to look at conditions at scales people lived by, and not only by boundaries that become more abstract the larger they get.
The missed data in other cities
Of course, many metro-focused agencies and organizations compile data similarly, but lack consistency of data, consistency of area, or consistency of time. Chicago’s done it at a grand scale for a long time.
It’s not difficult for most anyone or any agency to find information on all incorporated municipalities, and for subareas of a metro area’s core city: by zip code, for example, or police and fire districts or precincts. Oftentimes census tracts are used, but they can be too small to make any inferences for changes at a subarea level (a neighborhood or community). Also, the Census Bureau can change census tract boundaries from one decennial census to the next.
Some cities will gather data by specialized districts for department administrative purposes: community planning districts, or infrastructure or utility zones, public health areas. But administrative districts often only compile data for their own purposes, preventing their usage by other city departments. It’s also conceivable that each department has different boundaries, incompatible with each other, that, like census tracts, can and do change over time.
And even if all those other factors are accounted for, how far back does that data go? Most of the demographic data available at our fingertips via the internet goes back to 2000, maybe 1990; beyond that you’ll have to go to more niche internet sources or scour the many planning documents that still are located on bookcases in libraries across the country.
The Chicago data advantage
Because the Chicago School’s influence remains over the city and region, it’s not difficult at all to find a wealth of demographic information organized by community areas. Of course, the University of Chicago maintains links to all of the Local Community Fact Books produced.
As I mentioned earlier, the Chicago Metropolitan Agency for Planning has presented annual data for the Chicago metro area since 2015. Via the City of Chicago’s Data Portal, one can find information on public schools, tax increment financing districts, business licenses, rideshare usage, even television and film permits, all organized by the city’s designated Community Areas.
What about other cities/metros?
I did a quick scan of the six major metropolitan planning organizations (MPOs) and councils of governments (COGs) comparable in size to Chicago’s CMAP to see if any others had similarly gathered neighborhood and community data. How’d that look?
New York City: The New York region’s Metropolitan Transportation Council produces regular socioeconomic and demographic forecasts for its planning area, but they seem designed to forecast economic and demographic data like general population, employment and labor force, and housing, for the strict purposes of future transportation infrastructure improvements.
Los Angeles: The Los Angeles area’s Southern California Council of Governments (SCAG) gets a little closer to the Chicago model. SCAC prepared its SoCal Atlas in 2022, which include jurisdictional reports for the 197 cities and the unincorporated areas of the six counties the agency serves. However, it does not break down Los Angeles itself, a city of almost 4 million people, into any subcomponents.
Philadelphia: The Delaware Valley Regional Valley Commission gets even closer than Los Angeles does to the Chicago model, by matching 2020 U.S. Census data to Philadelphia’s 18 designated Planning Districts. Unfortunately, Philadelphia’s Planning Districts were established by the City of Philadelphia in 2011 and lack the historical component of Chicago’s Community Areas.
The next three largest MPOs, The Metropolitan Transit Commission serving the San Francisco Bay Area, the North Jersey Transportation Planning Authority that covers the 13-county portion of northern New Jersey, greater Dallas’ North Central Texas Council of Governments, diverge even further from the Chicago example. Each agency has extensive data portals available for public use. But they limit their data scope to their MPO mission: a focus on regional transportation and planning, an emphasis on gathering data to understand existing conditions, and generating forecasts for effective transportation infrastructure investment.
What does this ultimately mean?
In one sense, it does mean that over the last 15 years, Chicago’s not been afraid to expose its flaws. Economic and social inequality can be found throughout the city, as my last post on the disparity in violent crime rates between Chicago’s lakefront and interior neighborhoods showed.
However, similar differences can be found throughout the region as well. Whether it’s crime, income, school quality, mortgage lending practices, fiscal capacity of local municipalities or even service call response times, there are disparities within the city limits and among the hundreds of suburban communities that surround it. Yet little attention is given to the disparities because few regions have developed the data framework to do it.
Sometimes I think that part of Chicago’s reputation as an deeply divided city is because it developed this framework early on, and the tag stuck.
Unfortunately, there are scores of metro areas throughout the U.S. that simply haven’t done this kind of framing and are only now becoming aware that emphasizing the development of new and better communities does not make on its own make older, less desirable communities go away. They’ll learn the hard way.